Severity of Decline and its Causes
The first recorded sale of Atlantic swordfish was in 1817. The average size landed commercially has declined from 400-500 lbs. in 1861 (newspaper story), 300-400 lbs. by the turn of the 20th century, over 266 lbs. in 1961 (when longlining largely replaced harpoon, hand-line and rod and reel as the primary commercial gear used) to 88 lbs. today.� The international longline fleets target swordfish and tunas because they are the most valuable commercially.
Most swordfish - almost two of every three - are now caught before they have a chance to spawn.� On average, females do not mature until age 5 and about 150 lbs. and males mature at 3 years and 72 lbs.� Of the females caught commercially, 83% are still immature.� ICCAT's minimum size limit is now 41 lbs. (= 33 lbs. dressed weight), and U.S. longliners routinely "discard" 40-50% of the swordfish they catch because they are too small to sell legally.� Due to the trauma involved in longline retrieval (e.g., jaws and gills torn apart) virtually all of these fish (age 1 or 2) are either dead already or die soon thereafter.� In 1998, the U.S. fleet "discarded" 433 metric tons of such baby swordfish. Just imagine how many baby swordfish it takes to make a ton.
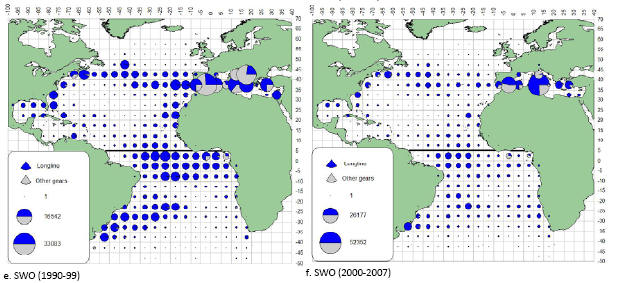
This is the result of many (smaller) vessels fishing in the swordfish's primary nursery areas, particularly those surrounding Florida (and in the fall, off Charleston, SC). See links at the bottom of this page for maps showing the locations of the spawning and nursery areas of this population. The largest U.S. vessels (the "distant water fleet") have had to travel farther each year to find sufficient swordfish. They now target them in their primary spawning areas between the Caribbean Islands and two large areas well east and south of the Virgin Islands in the Atlantic (the sites of major surface currents as shown below) during the early spring, then pursue the adults to their primary feeding areas on the Grand Banks until late fall. At the bottom of this page you can find links to the maps showing where longline effort and catch is concentrated.
After depleting the North Atlantic population, the international longline fleets moved to the South Atlantic and the Pacific Ocean.� However, after only a few years fishing out of Hawaii, most U.S. vessels left the Pacific and are concentrating on the South Atlantic population (see below) some as U.S. flag vessels and many re-flagged to avoid having to abide by U.S. regulations.� From the evidence we have, it is reasonable to conclude that all swordfish populations are in serious trouble, as noted below for the Atlantic.
The 1999 stock assessment used catch data through 1998.� It showed that the small quota reductions first imposed by ICCAT in 1997 may have slowed the decline. But, they were too little to cause the population to begin to rebuild. Fishing pressure (at 1.38) was still well above the MSY level and thus still too high. The population was close to 50% of the MSY level - considered the threshold for recruitment failure. Beyond that point the population has too few adults to sustain itself and, unless fishing pressure is reduced, it will continue to spiral downward. Eventually a point will be reached at which there are too few adults remaining to find each other for spawning. At that point, the population will decline to extinction even if all fishing were to be stopped.
"Fully Recovered" or Not?
A new stock assessment was conducted in 2002 using catch data through 2001. It depicts a dramatic increase in North Atlantic swordfish biomass even as both catch and catch per unit effort continued to decline. We believe this apparent abundance increase is not real, but contrived. The year after the 1999 stock assessment meeting at which Japan threatened to submit "different numbers in the future" they did so, submitting vastly different catch data (see Fig 1 near the bottom of page 60 in ICCAT's latest stock assessment) showing huge discards of very small swordfish in 2000 through 2003 (about 600 metric tons per year and twice that of the U.S. and Canada's, combined), which they knew would cause the stock assessment model to wrongly assume there had been an enormous increase in young fish reproduction and survival and thus a larger population building. (Japan, like any ICCAT member country, can submit any information it wants because there are no independent observers.) During these same 4 years, Japan also reported landing zero legal-size swordfish after previously reporting many years of landings averaging about 1300 tons per year. This would also dramatically skew the model's results. Why?
We suspect that the Japanese believed that if ICCAT's estimates of swordfish (or bluefin tuna) biomass continued to decline (as depicted above left and on our Bluefin page) it might be forced to limit its catches thus affecting Japan's extensive fleets targeting tuna and swordfish. In this context, it is important to recognize that Japan was recently exposed by the Australian government for having lied for many years about the tonnage of Southern Bluefin Tuna - a severely overfished stock subject to intense conservation efforts - they had been catching off Australia. Apparently, none of the Japanese catch data for tuna or swordfish can now be trusted, nor can stock assessments based on their data. Accordingly, we consider the abundance estimates from all ICCAT's swordfish stock assessments since 2000 to be bogus. With no change in total annual landings, the stock of North Atlantic swordfish could not miraculously recover from "severely overfished" - the status portrayed in the figures above - in just two years as ICCAT would have us believe. This "full recovery" has been manufactured by the submission to the stock assessment committee of intentionally misleading catch information, apparently just as the Japanese did for the Southern Bluefin Tuna stock assessments. However, it is curious that none of the scientists on this ICCAT committee (see pages 121 and 122 of ICCAT's detailed report) have "blown the whistle" and exposed this obvious charade that began in 2001 and continues today.
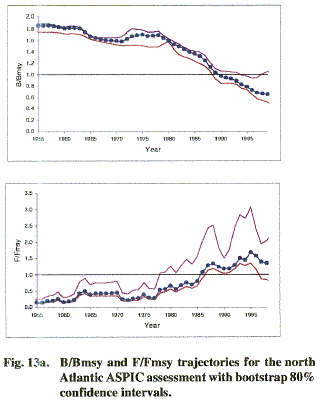
The population decline between 1990 and 2007 in both the North Atlantic and the South Atlantic (2 separate stocks) is even evident in ICCAT's figures from its most recent stock assessment, below. First the North Atlantic stock has been severely reduced and now, apparently, so has the South Atlantic. (As we show on our Bluefin page, the South Atlantic bluefin tuna stock, which most observers didn't even realize existed, was actually extirpated in just 10 years - 1960 to 1970.) The "Give Swordfish a Break" boycott campaign should be renewed while some swordfish still exist, and a new campaign begun to stop all lethal fishing on the much more severely depleted Western North Atlantic Bluefin - "our" bluefin tuna for which an "endangered species" listing has already been sought.
Capable of Rapid Recovery
Like bluefin tuna, swordfish are prolific egg producers - a large female can produce 30 million eggs each year.� The important point and the good news is that swordfish are capable of rapid recovery, if only given the chance.
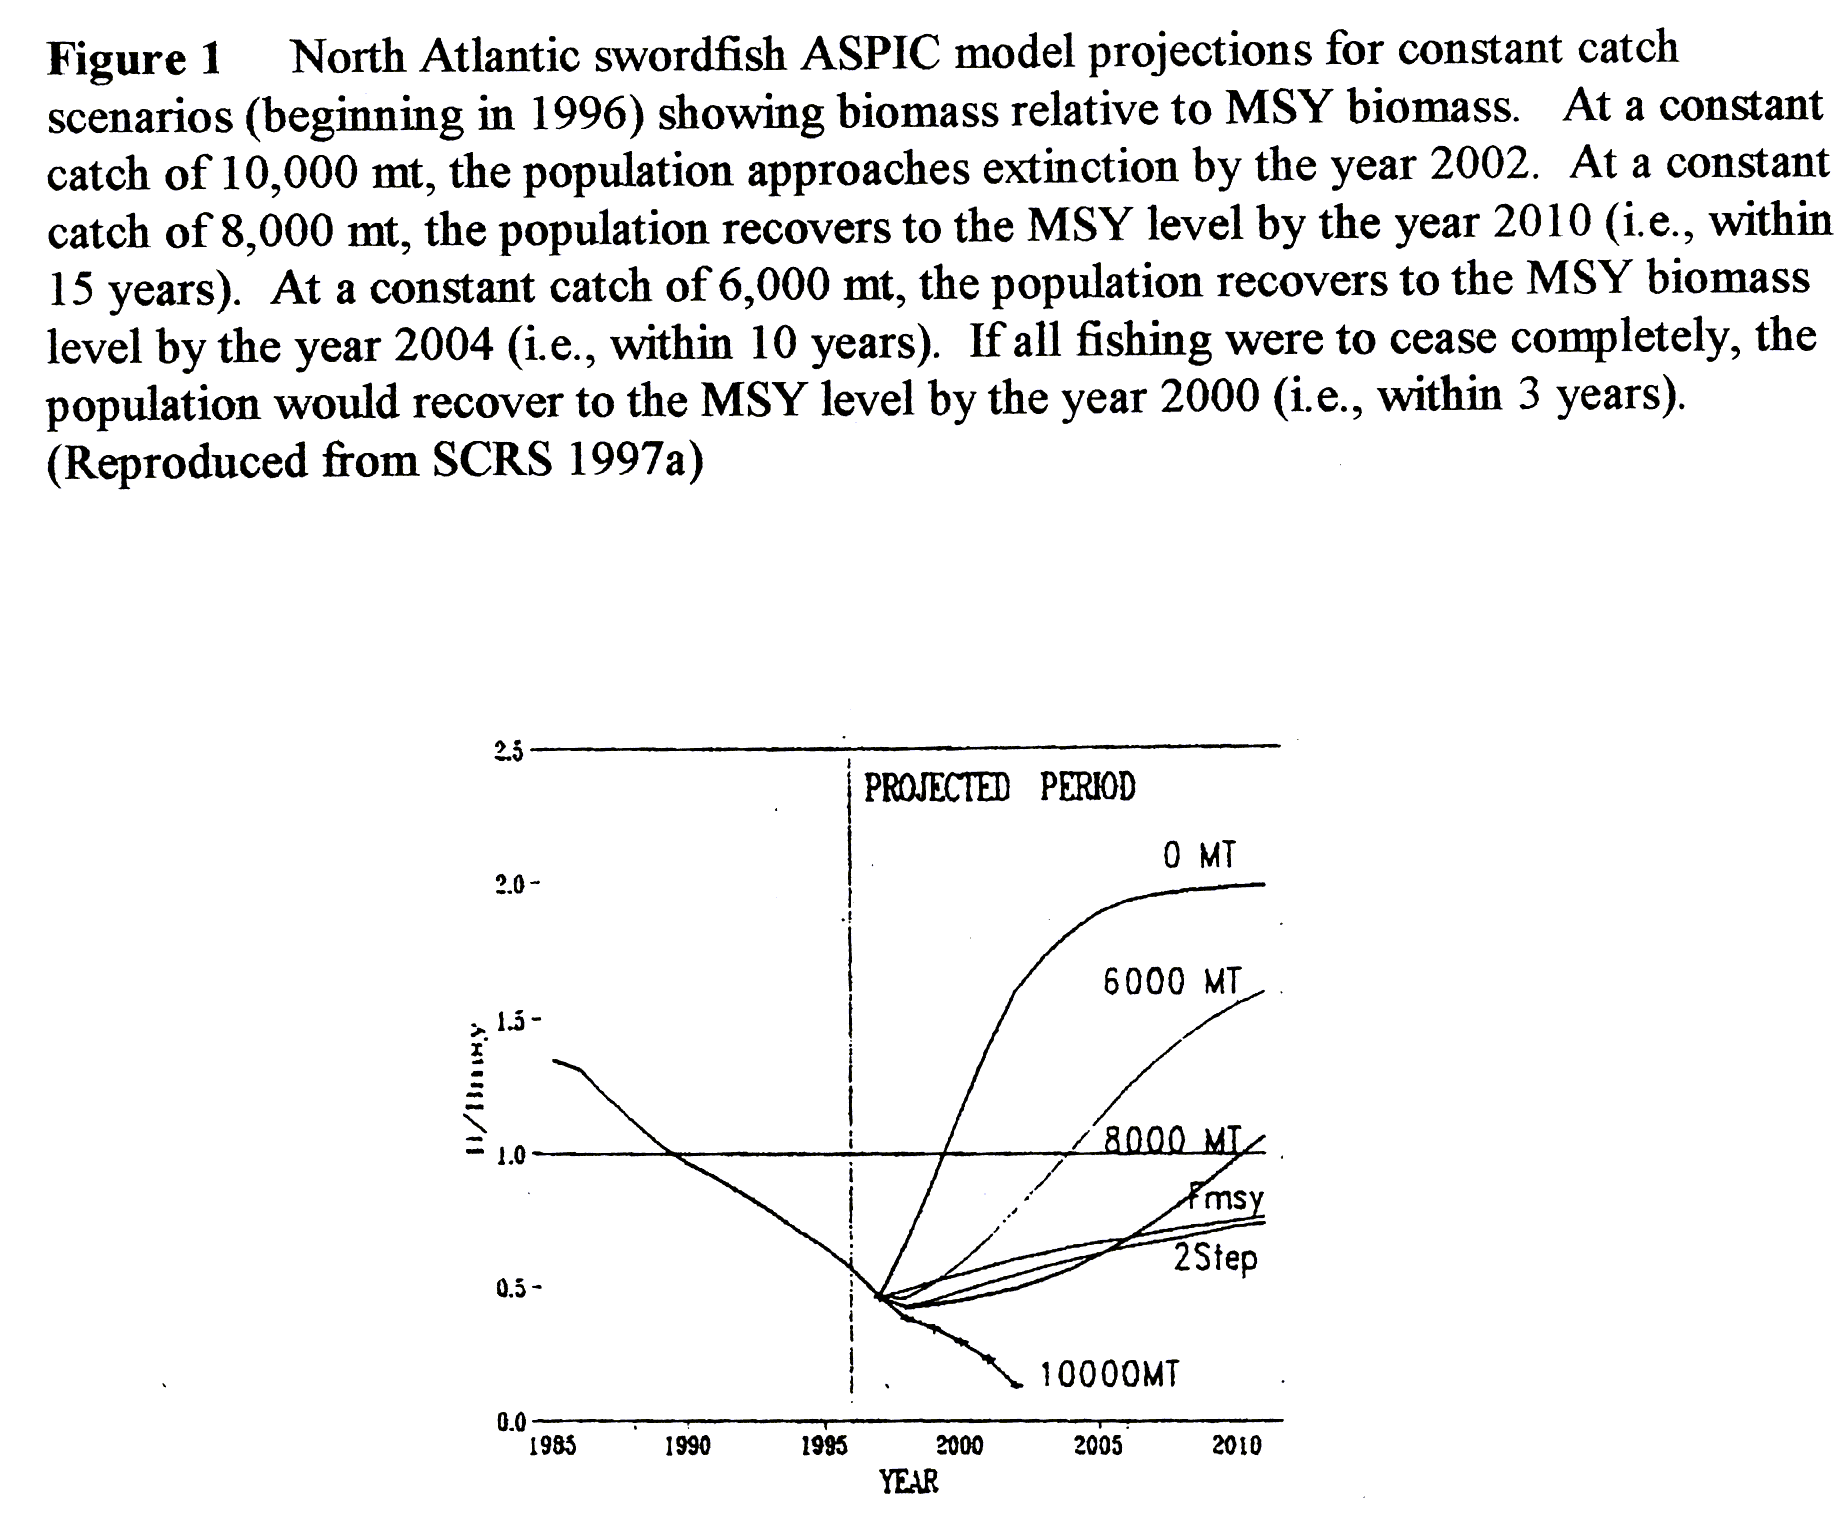
In 1996, ICCAT asked its scientific advisory committee to develop scenarios for rebuilding the stock (a) as rapidly as possible, (b) within 10 years and (c) within 15 years.� The results of these model runs are reproduced in the figure below.� These results identify how quickly the stock would recover to the MSY level under various levels of catch.� (However, these results were based on the situation that existed at the end of 1995.� Fishing pressure is still well above the level that would produce�the maximum sustainable yield (MSY).
Model results based on the stock at the end of 1995 indicated that
if all fishing were to cease immediately in 1996, the stock could recover to the MSY population level in 2-3 years. This is a very positive finding that shows the population IS capable of rapid recovery in a very short time.� (For comparison, even if all
commercial fishing were to cease, many of the large sharks may not recover within 50 years, if ever.)� The 1996 catch was estimated to be 16,000 metric tons (mt).�� According to ICCAT's scientific advisory committee
and as depicted below (Fig 1), a 10-year recovery would require the catch be limited to 6,000 mt (a 62 percent reduction); and a 15-year recovery to the MSY level would require a catch of no more than 8,000 mt per year (a 50% reduction).
Unfortunately, at its 1996 meeting, ICCAT chose to recommend a total catch of 11,300 mt for 1997, and additional reductions of 300 mt in 1998 and 1999.� These were nearly double that (6,000 mt) needed to begin to rebuild this population within a 10-year period, as now required by the U.S. Sustainable Fisheries Act.� Thus, ICCAT's quotas would merely slow, not stop, the precipitous decline, as confirmed by the 1999 stock assessment.� In no way can these token quota reductions be legitimately described as what is necessary to begin a REBUILDING PLAN.� In fact, as ICCAT's own projections below show clearly, a total catch of 10,000 mt will drive this population right into extinction in only 4 years (i.e., by 2003).� Total reported landings by ICCAT member countries (only) were estimated to be 16,000 mt in 1996 and 17,000 mt in 1997.�
Reported landings appear to have declined slightly in 1998.� Non-ICCAT member countries
(pirate fishing) continue to fish without any regulation.
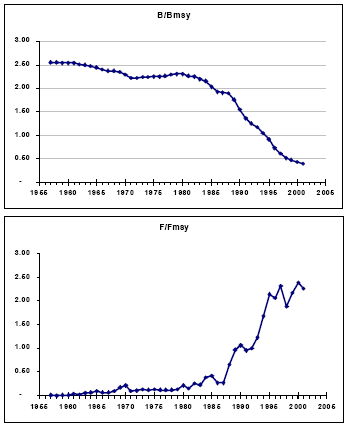
The cause, again, is unrestrained fishing pressure (rapidly exceeding the MSY level
by the end of 1995) that has been allowed by ICCAT, as depicted in the lower figure.
ICCAT says it is trying to keep all populations at their MSY level (1.0 on
the abundance figure - B/Bmsy - at left). Yet Atlantic swordfish abundance has
been allowed to decline by 85% since longlining began in 1960 and it is
still declining. Responsible fishery managers would never let a stock
decline below the MSY level (1.0 on the figure at left), yet ICCAT has let
this South Atlantic stock decline to about 40% of its MSY abundance. Excessive
fishing mortality, the cause of the abundance decline, was in 2002 over 2 times
the maximum (MSY) level, and ever since 1987, has been rising steeply (lower
figure).
For maps showing both the areas fished by U.S. longlines and the "hot spots" where swordfish, marlin and sailfish are taken most frequently (their spawning, nursery and feeding areas) click on the links below.
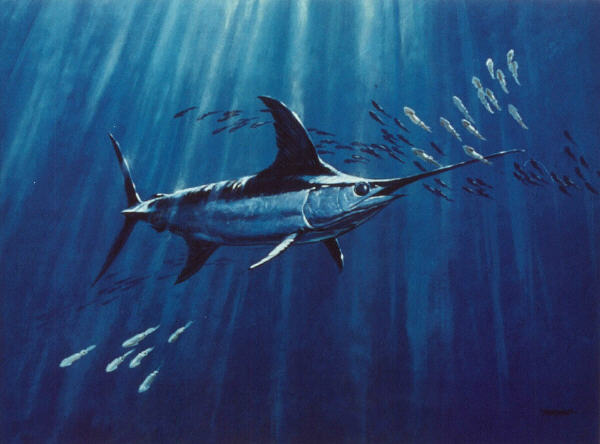
"Deephunter" by Al Barnes
Severity of Atlantic Population Declines
The Facts - Headed for Extinction
White Marlin
Blue Marlin
Bluefin Tuna
Bigeye Tuna
Sharks
Sailfish
Daily "Kill-o-Meter"
Endangered Species Act
White Marlin Listing Petition
Maps - White Marlin Critical Habitat
Maps of Atlantic Spawning and Feeding Areas
Swordfish, Bluefin, White Marlin, Blue Marlin, Sailfish
Blue Marlin "Hot Spots"
North Atlantic Current Patterns
Congress' Longline Closure Bills
Will They Work?
Jim Chambers

Chambers and Associates
Overview
Become a Sponsor
List of All Pages on this Website
Home
Index
Swordfish - 3 pages
Atlantic Blue Marlin - 3 pages
Pacific Blue Marlin - 3 pages
Black Marlin - 3 pages
Bluefin Tuna - 6 pages
Bigeye Tuna
Yellowfin Tuna
Sailfish
Large Sharks
Articles on Big Game Fish and Fishing
Index
9814 Kensington Parkway
Kensington, Maryland 20895
(T) (301) 949-7778�� (Fax) (301) 949-3003
and gets 1,500 page visits per day