Severity of the Atlantic Population's Decline
and its Causes
The Atlantic Ocean's bigeye tuna population has declined in abundance from a healthy level in 1961 (and even as recently as 1986) to an overfished condition by 2002. And, as will be shown below, the biomass of the spawning stock (adults) is estimated by ICCAT to have been driven to a severely overfished condition - just 35% of its MSY biomass - by 2008.
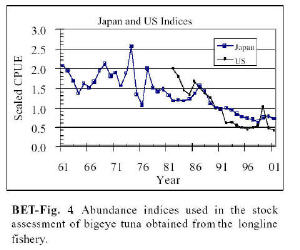
The figure below left depicted trends in the catch per unit effort for the extensive Japanese longline fleet which targets bigeye and the U.S. longline fleet. However, by 2001 the population had not yet reached a dangerously low level (which begins at 50% of the MSY level). Its overall abundance is estimated by ICCAT to have declined by about 58%, and it is declining moderately rapidly. The cause is overfishing allowed by ICCAT by thousands of commercial vessels from many nations, but primarily those of the European Union (EU). They land vast numbers of tiny bigeye in violation of their pledge to abide by ICCAT agreements setting minimum size limits (3.2 kg or 6.4 lbs.) and quotas. Almost 80% of Spain's recent landings of bigeye tuna have been smaller than the minimum size limit. ICCAT has yet to find the courage needed to force compliance by its members which routinely ignore its binding recommendations - recommendations they agreed to comply with as members of ICCAT.
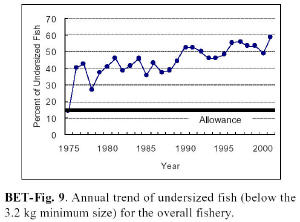
As depicted in the graph below right, the percentage of catch that is composed of juveniles weighing less than ICCAT's minimum size has reached 60% of the total bigeye tuna landed by all 39 member states. They are targeted primarily by Spain using purse seines in the bigeye's primary nursery areas off west Africa (particularly off Ghana) and by the other EU members in their nursery areas off Italy. The purse seines are set around Fish Aggregation Devices (FADs) that attract vast numbers of juvenile bigeye but also large numbers of juvenile sailfish, blue marlin, wahoo, dolphin, swordfish, etc., which are shoveled overboard dead and dying.

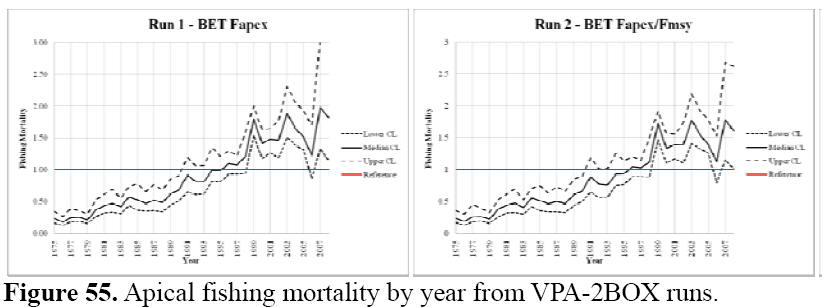
Shown below as Fig. 56 is ICCAT's latest (2010) portrayal of the decline in abundance (biomass) of spawning sized Atlantic bigeye tuna. The spawners' biomass (compared to their MSY biomass) is estimated by this method (Virtual Population Analysis) to have declined to about 35% of its MSY level and thus well below the danger level of 50% of the MSY level (the dotted horizontal line at 1.0). Any population's biomass level below MSY is considered to be "overfished" and any biomass below 50% of MSY is considered to be "recruitment overfished" which is much more serious. It means there are becoming too few adults to find each other at spawning therefore jeopardizing the ability of the population to sustain itself. Atlantic bigeye are estimated by ICCAT's scientific committee to be 15% below this dangerous threshold. Eventually, at some point, the population will reach a level at which it can not recover even if all fishing were to cease. We do not know what this level is, but the Atlantic bigeye population may be getting close. In the lower pair of graphs (Fig. 55) is ICCAT's portrayal of the cause of this continuing decline - overfishing being allowed by ICCAT. Any fishing pressure level which is greater than that which would produce the MSY (the red line at 1.0 on these figures) is considered "overfishing." By 2008, fishing pressure on bigeye had risen to an estimated two times the MSY level, or twice as high a responsible fishery manager would allow..
The Severity of Atlantic Population Losses
The Facts - Headed for Extinction
Blue Marlin and White Marlin
Bluefin Tuna
Swordfish
Sailfish
Sharks
Daily "Kill-o-Meter"
Endangered Species Act
White Marlin Listing Petition
Articles on Big Game Fish and Fishing
Overview
Hunting Giants
Hunting Grander Blue Marlin and Bluefin in the Azores
Those Magnificent Giants
Going, Going, Gone
Headed for Extinction
Chambers and Associates
Overview
List of All Pages on our Website
Home
Index
Bigeye Tuna
Swordfish - 4 pages
Giant Bluefin Tuna - 6 pages
Black Marlin - 3 pages
Atlantic Blue Marlin - 3 pages
Pacific Blue Marlin - 3 pages
Yellowfin Tuna
White Marlin
Spearfish
Sailfish
Large Sharks
9814 Kensington Parkway
Kensington Maryland 20895-3425
(T) 301-949-7778 (Fax) 301-949-3003